Everything you need to know about mobile app analytics
Imagine this: you’ve launched a popular mobile application on the app store. Your next step is to establish strong connections with your app’s audience. How do you do it? The answer is clear: by analyzing and strengthening these connections using key mobile app metrics.
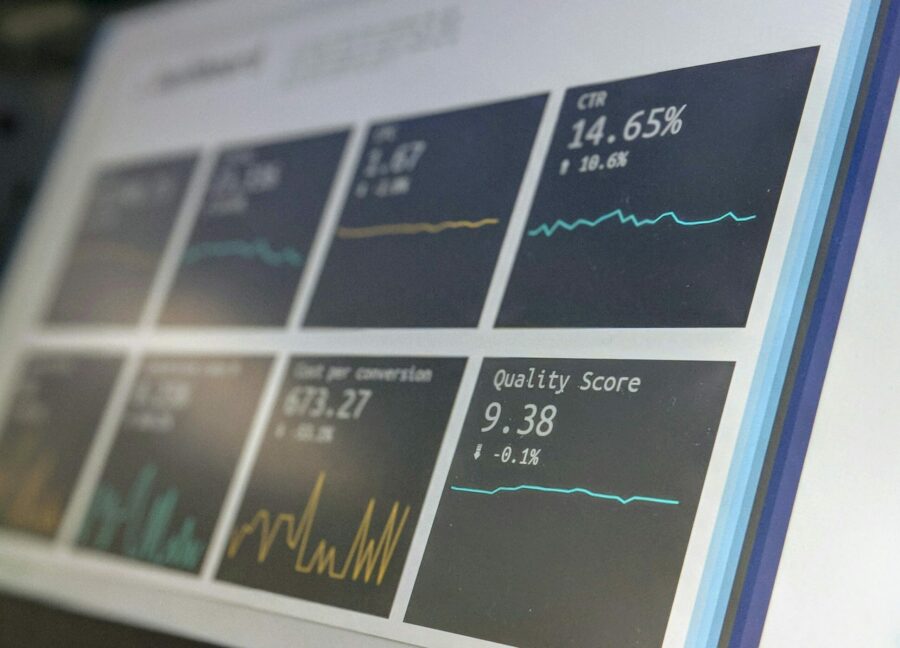
In this article, the Touchlane team will introduce you to the fundamental metrics that you can track using Firebase, Mixpanel, or Google Analytics 4 (GA4). These insights will give you a better understanding of how your app performs and help you chart the right course for improvement.

Where to start
01.
Retention rate
Attracting new users may seem like a primary marketing goal, but it’s only the first step to success. Retaining them is equally important, if not more.
Your app’s retention rate is determined by the number of users who return over time. This is a core metric in mobile app traffic analysis that shows your app’s popularity and longevity. To calculate it, apply the following formula:
A = (B – C) / D x 100%
where:
- A stands for the retention rate
- B stands for the number of users at the end of the period
- C stands for the number of users acquired during the period
- D stands for the number of users at the beginning of the period.
The formula applies to any period. We suggest you track metrics of 1-day, 7-day, and 28-day retention.
! Touchlane’s pro tip:
02.
Installation source
To optimize your efforts and pick out the best channels for advertising, you have to understand where users find your app. This could be done by determining installation sources.
There are several ways to help you with tracking the installation source. The most commonly used one is creating UTM tags for each advertising channel and inserting them into the link leading to the app store.
! Touchlane’s pro tip:
As soon as your mobile application analytics system receives these tags, it captures the source of the analytics information.
There’s also the option to use auto-tagging in Google Ads campaigns that allows GA4 to recognize the source of traffic to your app. When this feature is enabled, the app URL has a unique attribute added to it that directs consumers to download it.
(learn more about GA4 auto-tagging)
Additionally, we advise using a mix of tactics to track the origins of app installations:
- assign referral codes to marketing channels and campaigns
- employ deep linking to direct users to specific app pages or content
- implement device fingerprinting to collect and analyze such device attributes as IP address, user agent, and device model to determine the source of installations
- for advanced analytics, make use of third-party attribution platforms and SDKs designed specifically for mobile apps. Some examples of these include Adjust, AppsFlyer, Branch, and Kochava
- use in-app analytics tools to monitor the app’s user activity and acquisition channels.

03.
Number of unique users
This metric could assist you in assessing how valuable your app is to its target demographic. It has three parameters, namely:
DAU (Daily Active Users) = number of individual users who open your app in a day
WAU (Weekly Active Users) = number of individual users who open your app in a week
MAU (Monthly Active Users) = number of individual users who open your app in a month.
! Touchlane’s pro tip:
04.
Sessions
In terms of session analysis, look at the average session length (ASL) and the app screens that users have visited. These indicators provide insight into their in-app behavior.
A session duration tells you how long people spend using your app and how engaging it is. The formula to compute ASL is:
ASL = T / N
where:
- T is the total number of sessions for the period
- N is the total duration of sessions.
! Touchlane’s pro tip:
Inspecting the visited app screens offers you insights into the areas that users find most interesting and useful, as well as how they utilize the in-app features.
The screens where most user sessions terminate are significantly more crucial to observe. For example, if your app lacks authorization, this may frighten people away and be the cause of their departure.
To optimize your development approach, examine user behavior. See which screens work well and which ones should be improved, changed, or eliminated to give your users more value.

05.
Monetization
Monetization is directly related to your income, therefore, it’s necessary to have an idea about how much and how often your users pay.
We recommend evaluating the effectiveness of your monetization policy using the following metrics:
ARPU (Average Revenue Per User) = Gross / MAU (can also be calculated for DAU or WAU)
This metric can serve as a benchmark of how appealing the app price strategy is to consumers. In addition, it measures the overall effectiveness of the project.
CPA (Cost Per Acquisition) = Costs / Number of acquisitions or conversion
CPA determines the costs of bringing in new users within the confines of a dedicated marketing campaign.
LTV (Lifetime Value) = ARPU x Average Lifetime of a user
! Touchlane’s pro tip:
Conclusion
By interpreting mobile data app analytics, it’s possible to pinpoint areas for improving your app’s performance. To achieve long-term success, monitor user behavior and adapt strategies accordingly.
Still unsure about how to make sense of all this data? The Touchlane team is here for you. We proudly nurture our projects from product discovery to analytics and ASO. Book a consultation with us – and let’s get the most out of your app analytics together to unlock its full potential.
RELATED SERVICES
CUSTOM SOFTWARE DEVELOPMENT
If you have an idea for a product along with put-together business requirements, and you want your time-to-market to be as short as possible without cutting any corners on quality, Touchlane can become your all-in-one technology partner, putting together a cross-functional team and carrying a project all the way to its successful launch into the digital reality.
If you have an idea for a product along with put-together business requirements, and you want your time-to-market to be as short as possible without cutting any corners on quality, Touchlane can become your all-in-one technology partner, putting together a cross-functional team and carrying a project all the way to its successful launch into the digital reality.
We Cover
- Design
- Development
- Testing
- Maintenance


